Benchmark Results
This page presents the complete evaluation results of Visual Foundation Models on the SpaRRTa benchmark.
Leaderboard
Overall Rankings
The table below shows the mean rank across all environments and probing methods:
| Rank | Model | Mean Rank (Ego) | Mean Rank (Allo) | Overall |
|---|---|---|---|---|
| 🥇 | DINO-v2 (+reg) ViT-L/14 | 1.00 | 1.20 | 1.10 |
| 🥈 | VGGT ViT-L/14 | 2.40 | 1.20 | 1.80 |
| 🥉 | DINOv3 | 2.80 | 2.60 | 2.70 |
| 4 | DINO-v2 ViT-B/14 | 5.00 | 4.20 | 4.60 |
| 5 | MAE | 5.00 | 8.00 | 6.50 |
| 6 | DINO-v2 (+reg) ViT-B/14 | 3.00 | 4.00 | 3.50 |
| 7 | DINO | 4.80 | 3.20 | 4.00 |
| 8 | CroCo v2 | 9.00 | 10.40 | 9.70 |
| 9 | CroCo | 10.80 | 11.20 | 11.00 |
| 10 | SPA | 9.00 | 10.00 | 9.50 |
| 11 | MaskFeat | 11.40 | 12.00 | 11.70 |
| 12 | DeiT | 9.20 | 5.80 | 7.50 |
| 13 | CLIP | 13.00 | 11.40 | 12.20 |
Egocentric Task Results
Complete Results Table
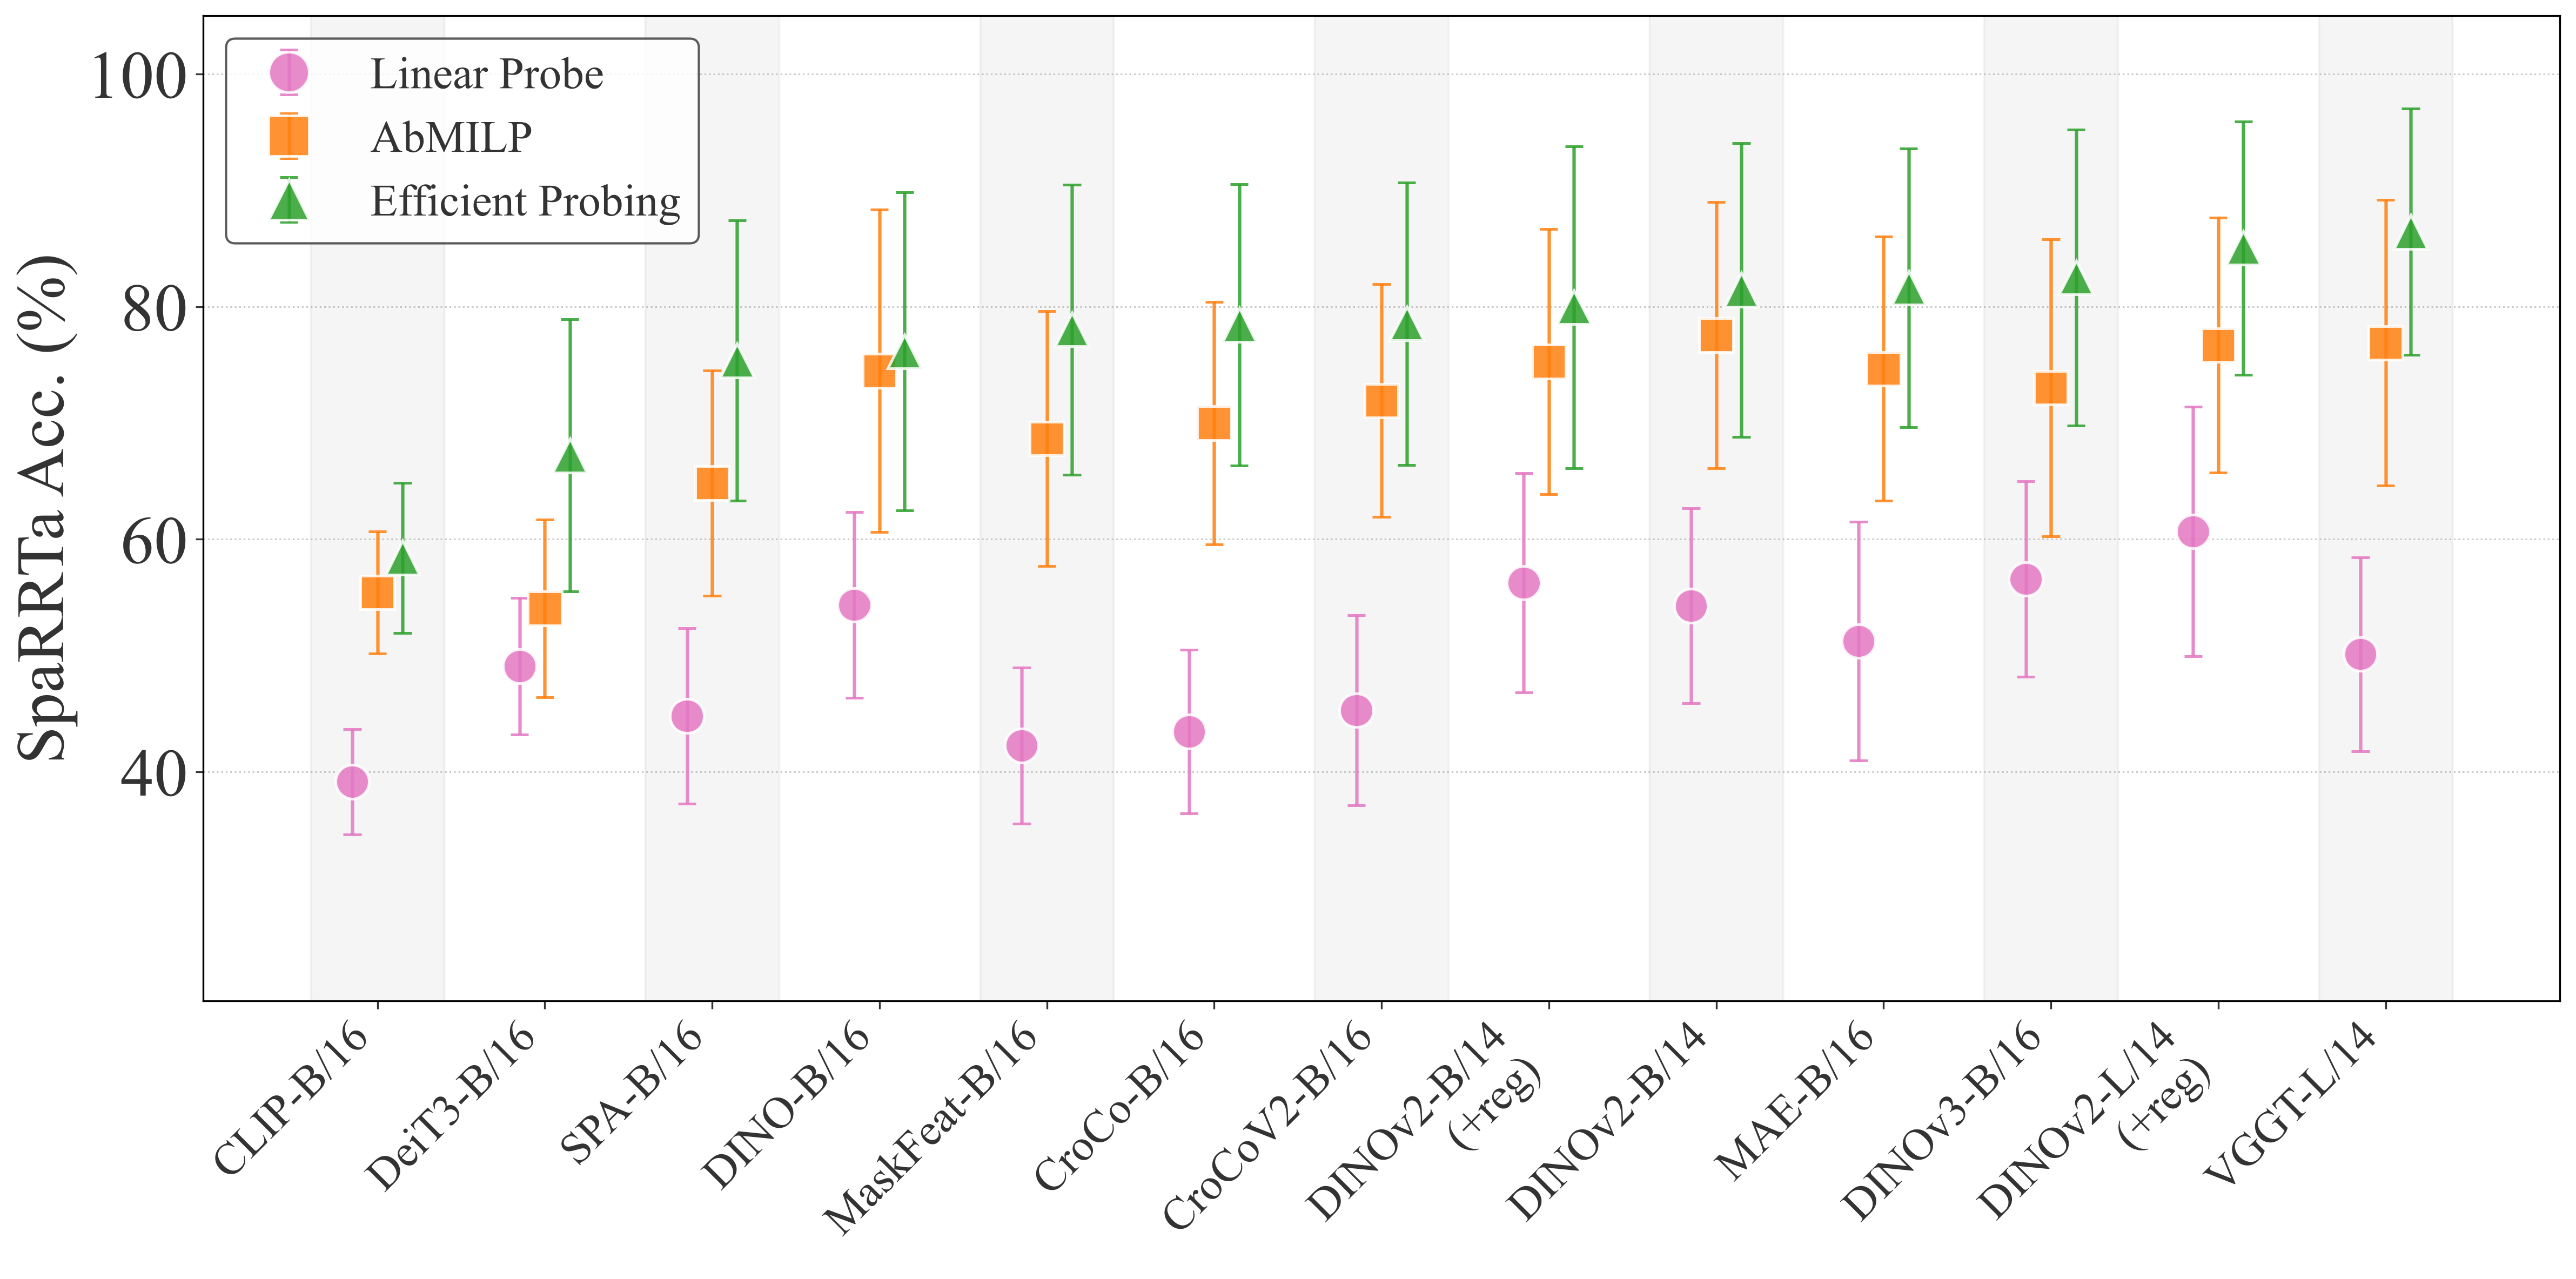
| Model | Linear | AbMILP | Efficient |
|---|---|---|---|
| DINO | 64.76 | 85.53 | 89.28 |
| DINO-v2 (B/14) | 59.91 | 86.36 | 91.91 |
| DINO-v2 reg (B/14) | 60.81 | 83.81 | 91.60 |
| DINO-v2 reg (L/14) | 65.37 | 86.59 | 93.92 |
| DINOv3 | 62.41 | 84.71 | 93.93 |
| VGGT (L/14) | 52.10 | 89.90 | 96.18 |
| SPA | 52.91 | 73.01 | 78.33 |
| CroCo | 46.25 | 75.19 | 88.98 |
| CroCo v2 | 54.14 | 76.18 | 90.48 |
| CLIP | 36.66 | 55.85 | 56.33 |
| DeiT | 53.23 | 61.33 | 75.49 |
| MAE | 62.82 | 84.26 | 93.10 |
| MaskFeat | 47.20 | 74.60 | 89.66 |
| Model | Linear | AbMILP | Efficient |
|---|---|---|---|
| DINO | 55.14 | 89.34 | 92.10 |
| DINO-v2 (B/14) | 64.57 | 90.64 | 93.94 |
| DINO-v2 reg (B/14) | 69.40 | 86.73 | 94.63 |
| DINO-v2 reg (L/14) | 79.68 | 89.03 | 96.70 |
| DINOv3 | 65.34 | 86.96 | 97.47 |
| VGGT (L/14) | 63.42 | 90.03 | 98.78 |
| SPA | 49.39 | 72.58 | 90.80 |
| CroCo | 48.77 | 80.75 | 89.88 |
| CroCo v2 | 52.53 | 81.91 | 90.88 |
| CLIP | 37.65 | 56.29 | 68.44 |
| DeiT | 54.75 | 52.45 | 78.22 |
| MAE | 58.36 | 87.34 | 93.71 |
| MaskFeat | 42.87 | 81.52 | 92.87 |
| Model | Linear | AbMILP | Efficient |
|---|---|---|---|
| DINO | 61.97 | 87.05 | 89.32 |
| DINO-v2 (B/14) | 58.03 | 88.41 | 93.26 |
| DINO-v2 reg (B/14) | 65.38 | 86.59 | 91.52 |
| DINO-v2 reg (L/14) | 69.02 | 85.15 | 94.92 |
| DINOv3 | 66.14 | 83.56 | 93.18 |
| VGGT (L/14) | 59.24 | 87.24 | 95.53 |
| SPA | 49.62 | 74.01 | 90.89 |
| CroCo | 49.32 | 83.17 | 87.95 |
| CroCo v2 | 53.56 | 85.20 | 89.62 |
| CLIP | 44.09 | 61.57 | 63.21 |
| DeiT | 54.24 | 62.42 | 75.98 |
| MAE | 62.80 | 85.84 | 93.26 |
| MaskFeat | 47.80 | 78.63 | 91.21 |
| Model | Linear | AbMILP | Efficient |
|---|---|---|---|
| DINO | 63.34 | 89.48 | 89.86 |
| DINO-v2 (B/14) | 66.69 | 89.63 | 93.75 |
| DINO-v2 reg (B/14) | 67.15 | 88.49 | 93.52 |
| DINO-v2 reg (L/14) | 69.59 | 89.40 | 96.11 |
| DINOv3 | 67.29 | 87.11 | 94.82 |
| VGGT (L/14) | 58.92 | 88.49 | 96.11 |
| SPA | 56.90 | 77.06 | 88.72 |
| CroCo | 55.57 | 81.86 | 92.68 |
| CroCo v2 | 56.25 | 83.52 | 91.01 |
| CLIP | 45.35 | 61.13 | 64.71 |
| DeiT | 56.17 | 64.10 | 81.40 |
| MAE | 62.50 | 88.11 | 93.83 |
| MaskFeat | 53.89 | 82.85 | 92.30 |
| Model | Linear | AbMILP | Efficient |
|---|---|---|---|
| DINO | 53.01 | 83.89 | 82.45 |
| DINO-v2 (B/14) | 53.24 | 85.31 | 93.00 |
| DINO-v2 reg (B/14) | 57.15 | 82.98 | 93.00 |
| DINO-v2 reg (L/14) | 64.79 | 82.38 | 94.27 |
| DINOv3 | 56.93 | 81.63 | 92.40 |
| VGGT (L/14) | 46.08 | 83.99 | 94.47 |
| SPA | 45.48 | 69.75 | 80.27 |
| CroCo | 44.88 | 74.93 | 87.95 |
| CroCo v2 | 43.90 | 77.93 | 85.99 |
| CLIP | 42.92 | 62.58 | 64.67 |
| DeiT | 43.38 | 55.50 | 76.50 |
| MAE | 52.87 | 78.77 | 89.00 |
| MaskFeat | 44.80 | 72.67 | 77.64 |
Allocentric Task Results
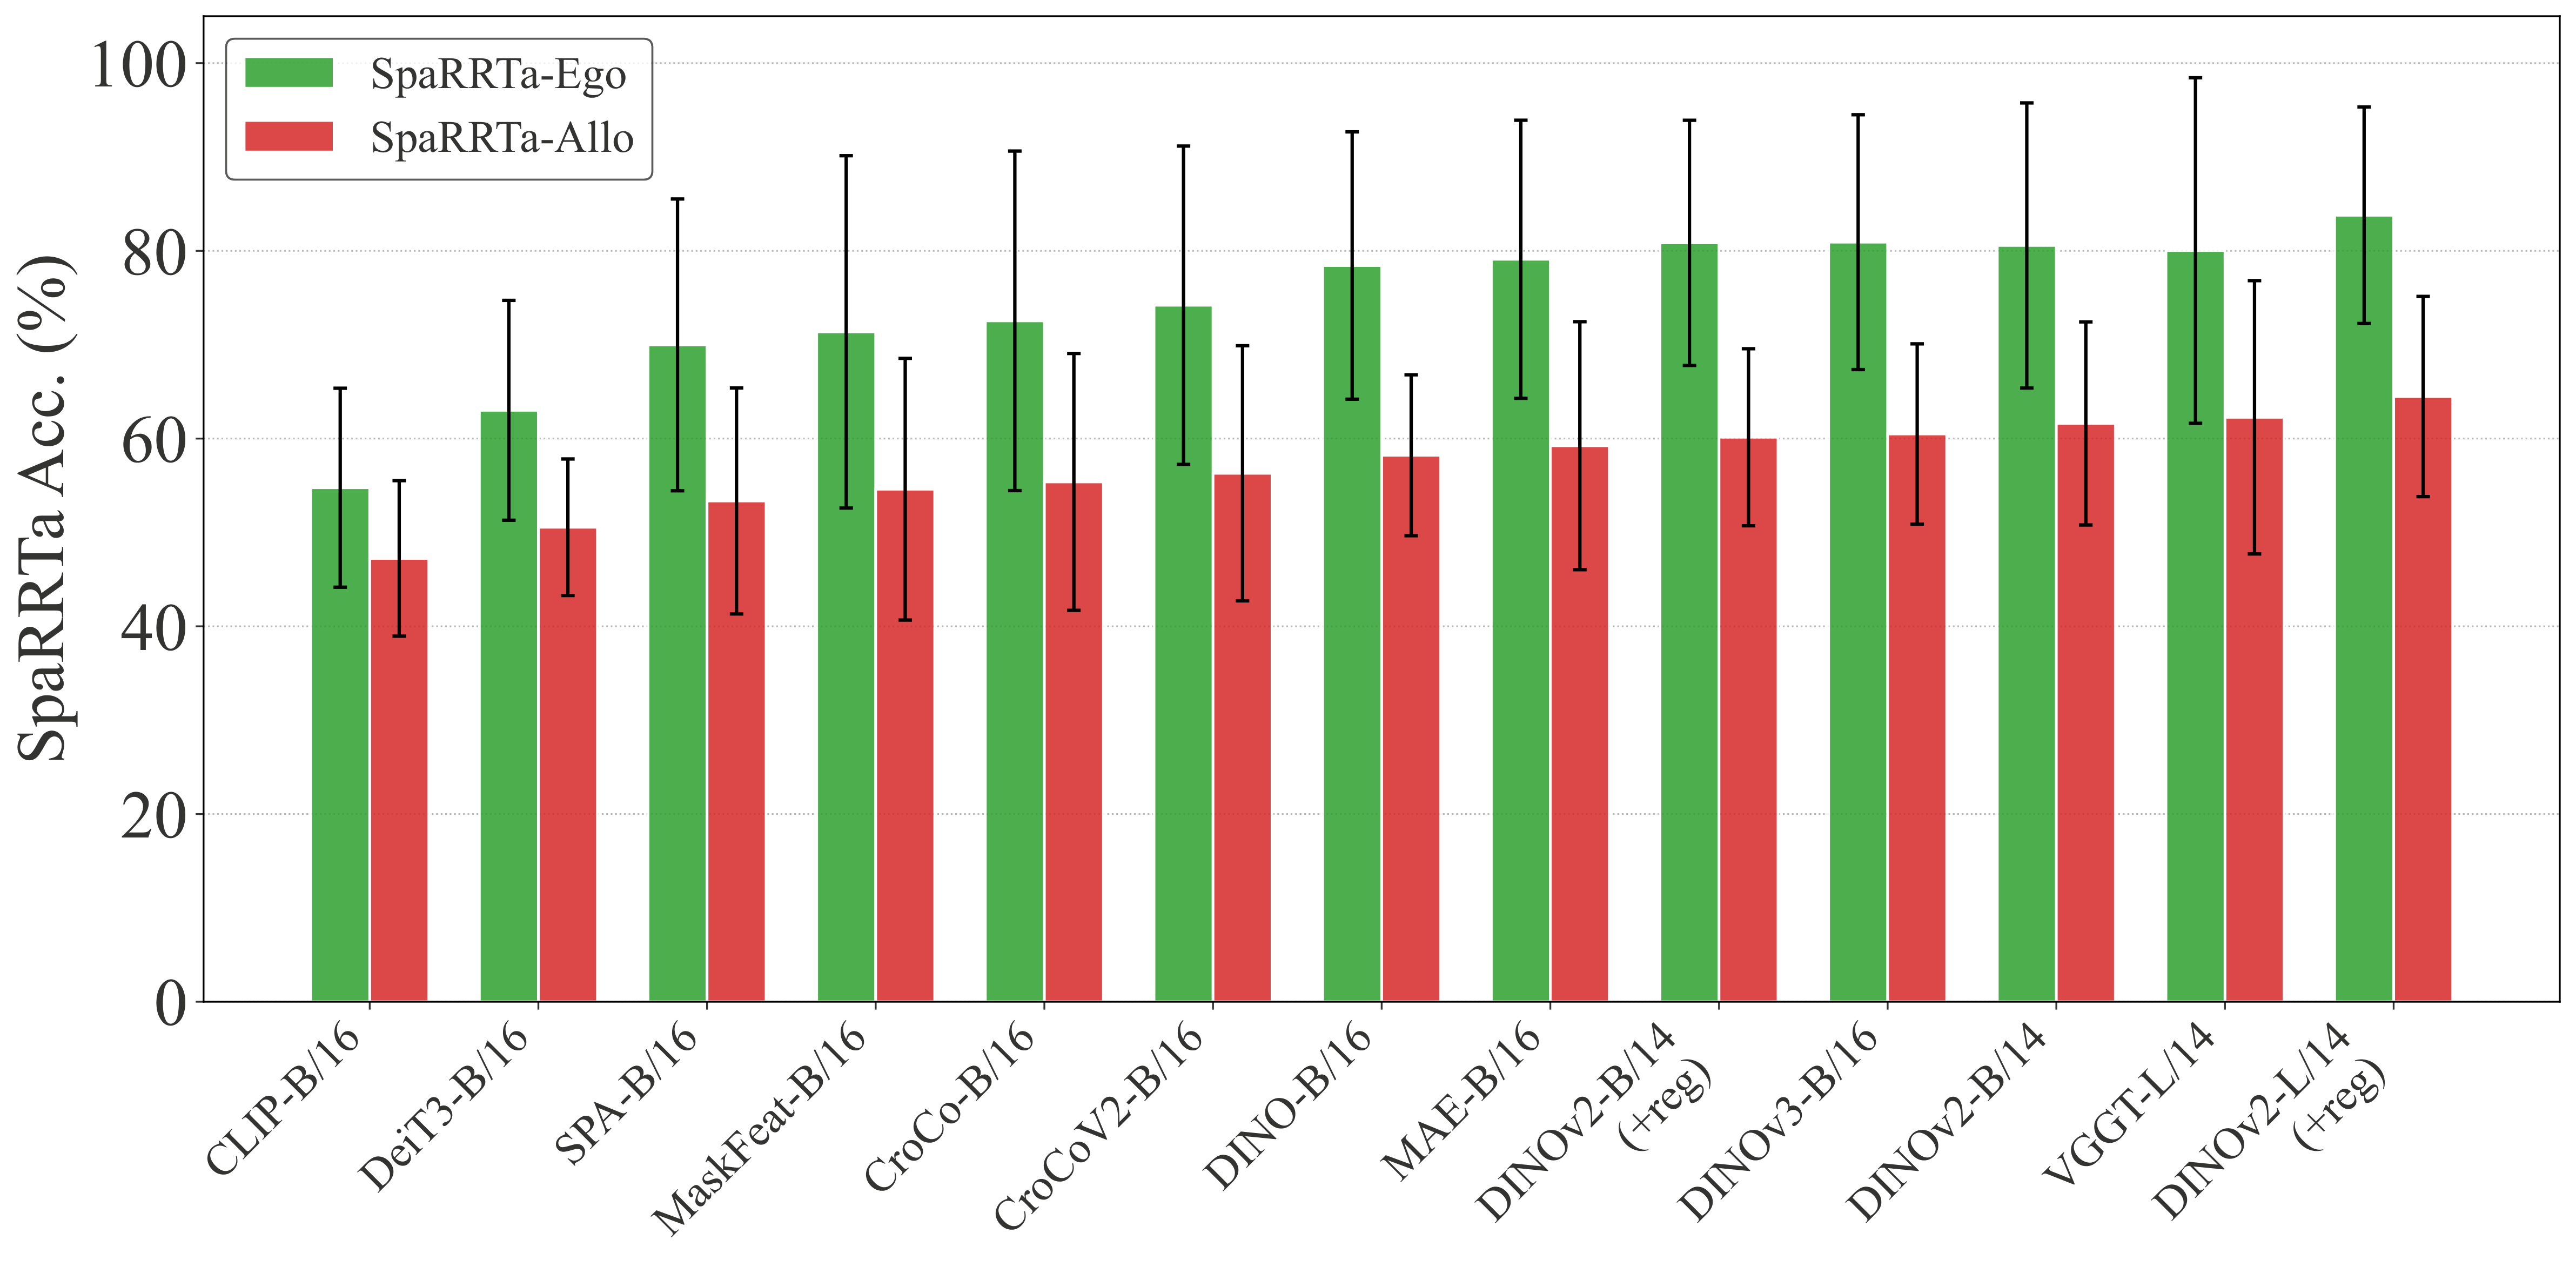
Performance Gap
All models show a significant performance drop on the allocentric task compared to egocentric. This highlights the challenge of perspective-taking for current VFMs.
Allocentric Performance Summary
| Model | Avg Linear | Avg AbMILP | Avg Efficient |
|---|---|---|---|
| DINO | 49.07 | 62.11 | 64.38 |
| DINO-v2 (B/14) | 47.90 | 65.91 | 71.20 |
| DINO-v2 reg (B/14) | 48.23 | 63.80 | 68.06 |
| DINO-v2 reg (L/14) | 51.68 | 66.86 | 76.10 |
| DINOv3 | 49.51 | 60.87 | 72.05 |
| VGGT (L/14) | 42.70 | 65.71 | 76.65 |
| SPA | 38.37 | 55.52 | 66.14 |
| CroCo | 37.89 | 61.88 | 68.37 |
| CroCo v2 | 37.86 | 62.77 | 67.69 |
| CLIP | 36.77 | 51.40 | 54.36 |
| DeiT | 45.42 | 49.31 | 57.88 |
| MAE | 42.61 | 64.45 | 70.66 |
| MaskFeat | 35.23 | 59.26 | 69.13 |
Environment Analysis
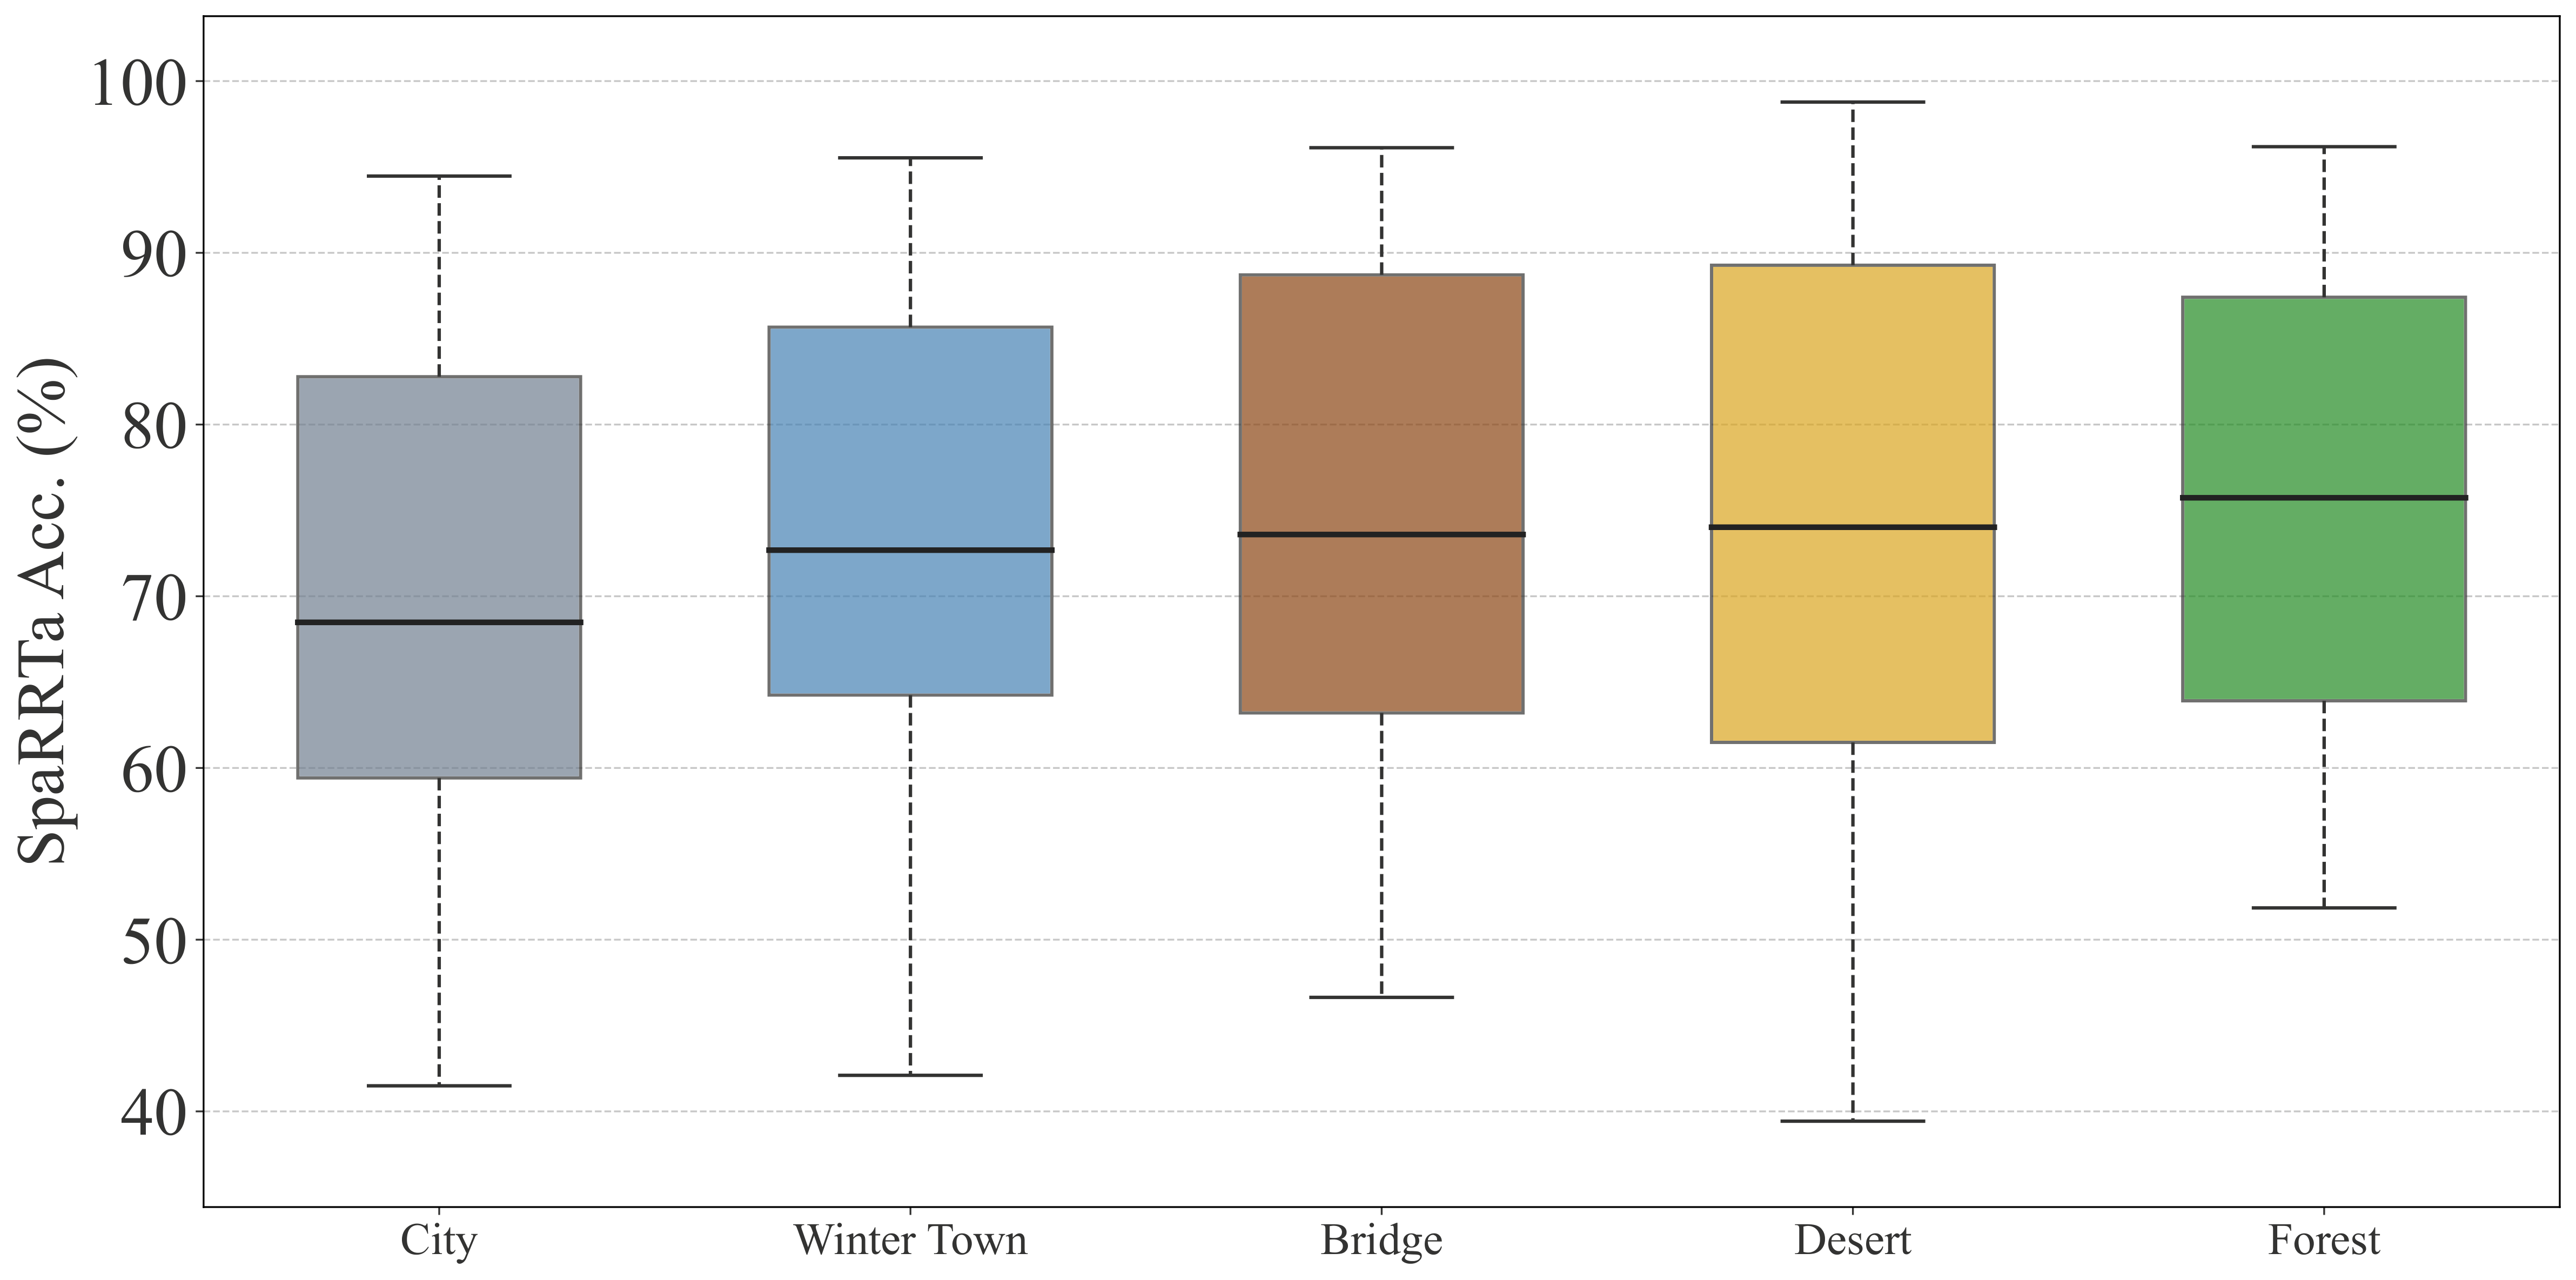
Environment Difficulty Ranking
From easiest to hardest:
- Forest - Natural complexity but clear object boundaries
- Desert - Sparse, homogeneous, minimal occlusion
- Bridge - Mixed complexity, infrastructure elements
- Winter Town - Snow occlusion, village clutter
- City - Dense urban geometry, maximum visual complexity
Key Insight
Environmental complexity significantly affects performance. Models struggle more in cluttered environments (City, Winter Town) compared to sparse environments (Forest, Desert).
Probing Method Comparison
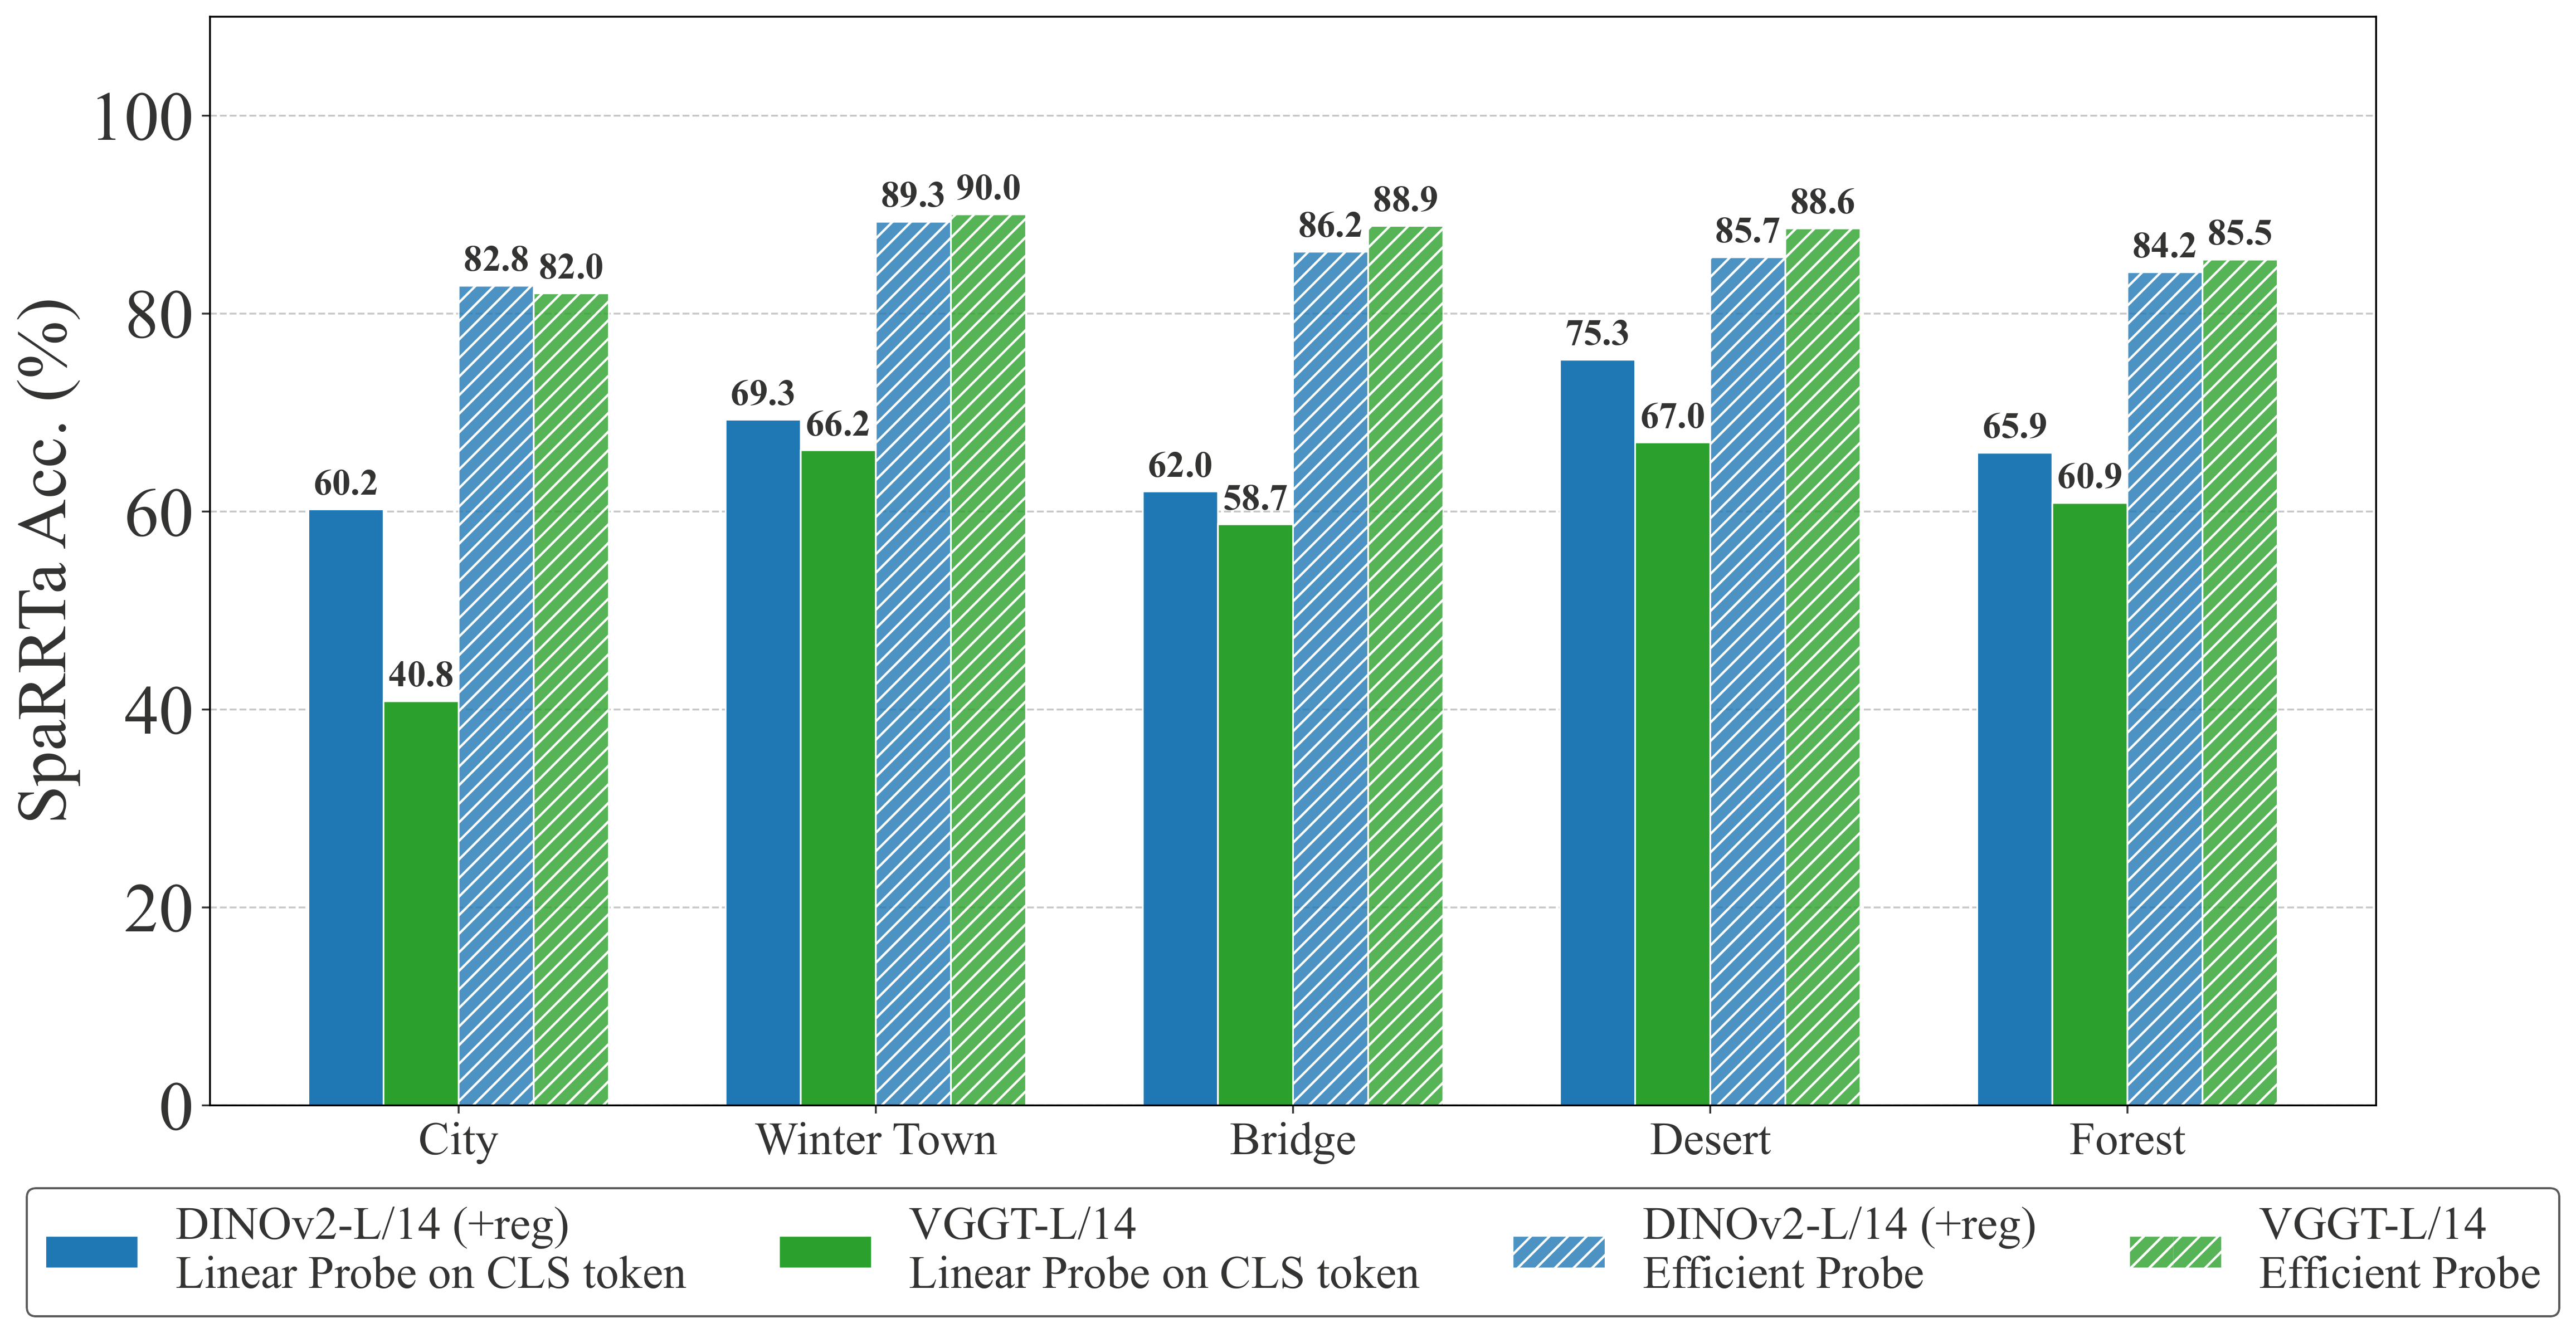
Performance Hierarchy
Key Finding: Spatial information is primarily encoded at the patch level and is largely lost through global average pooling. Selective probing mechanisms consistently unlock hidden spatial capabilities.
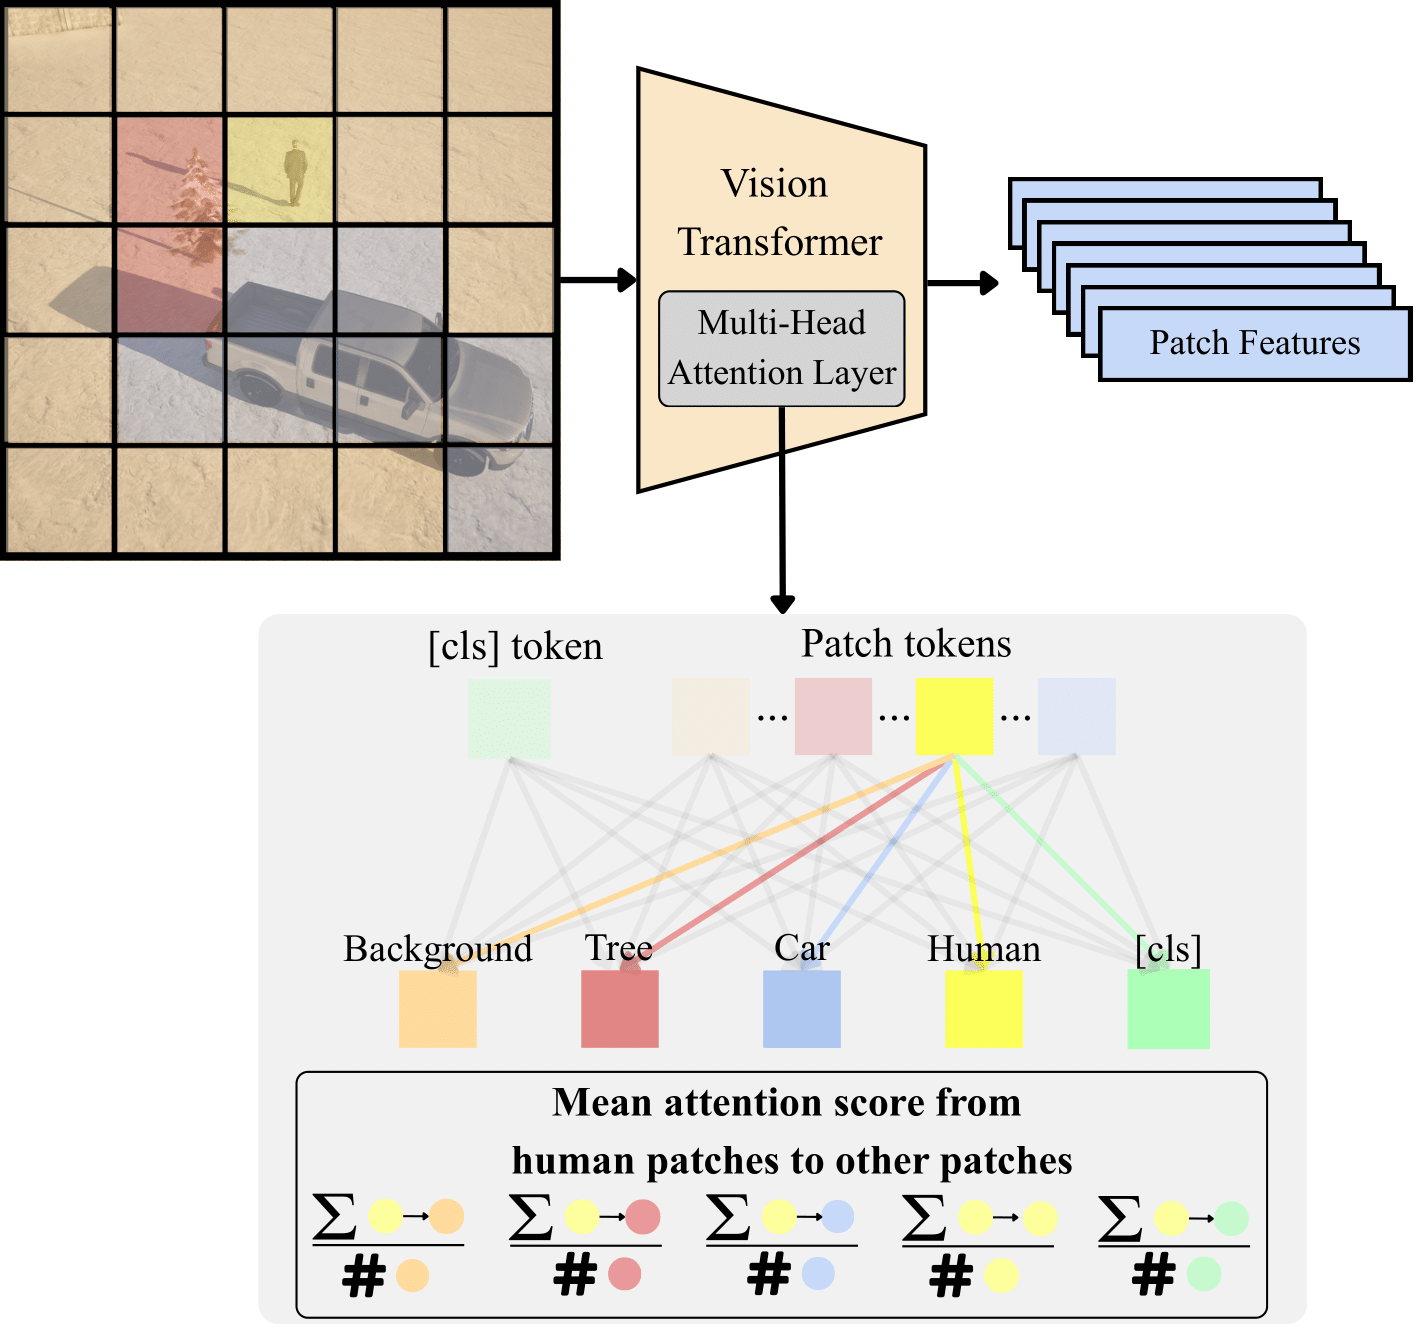
Attention Visualizations
Efficient Probing Attention Maps
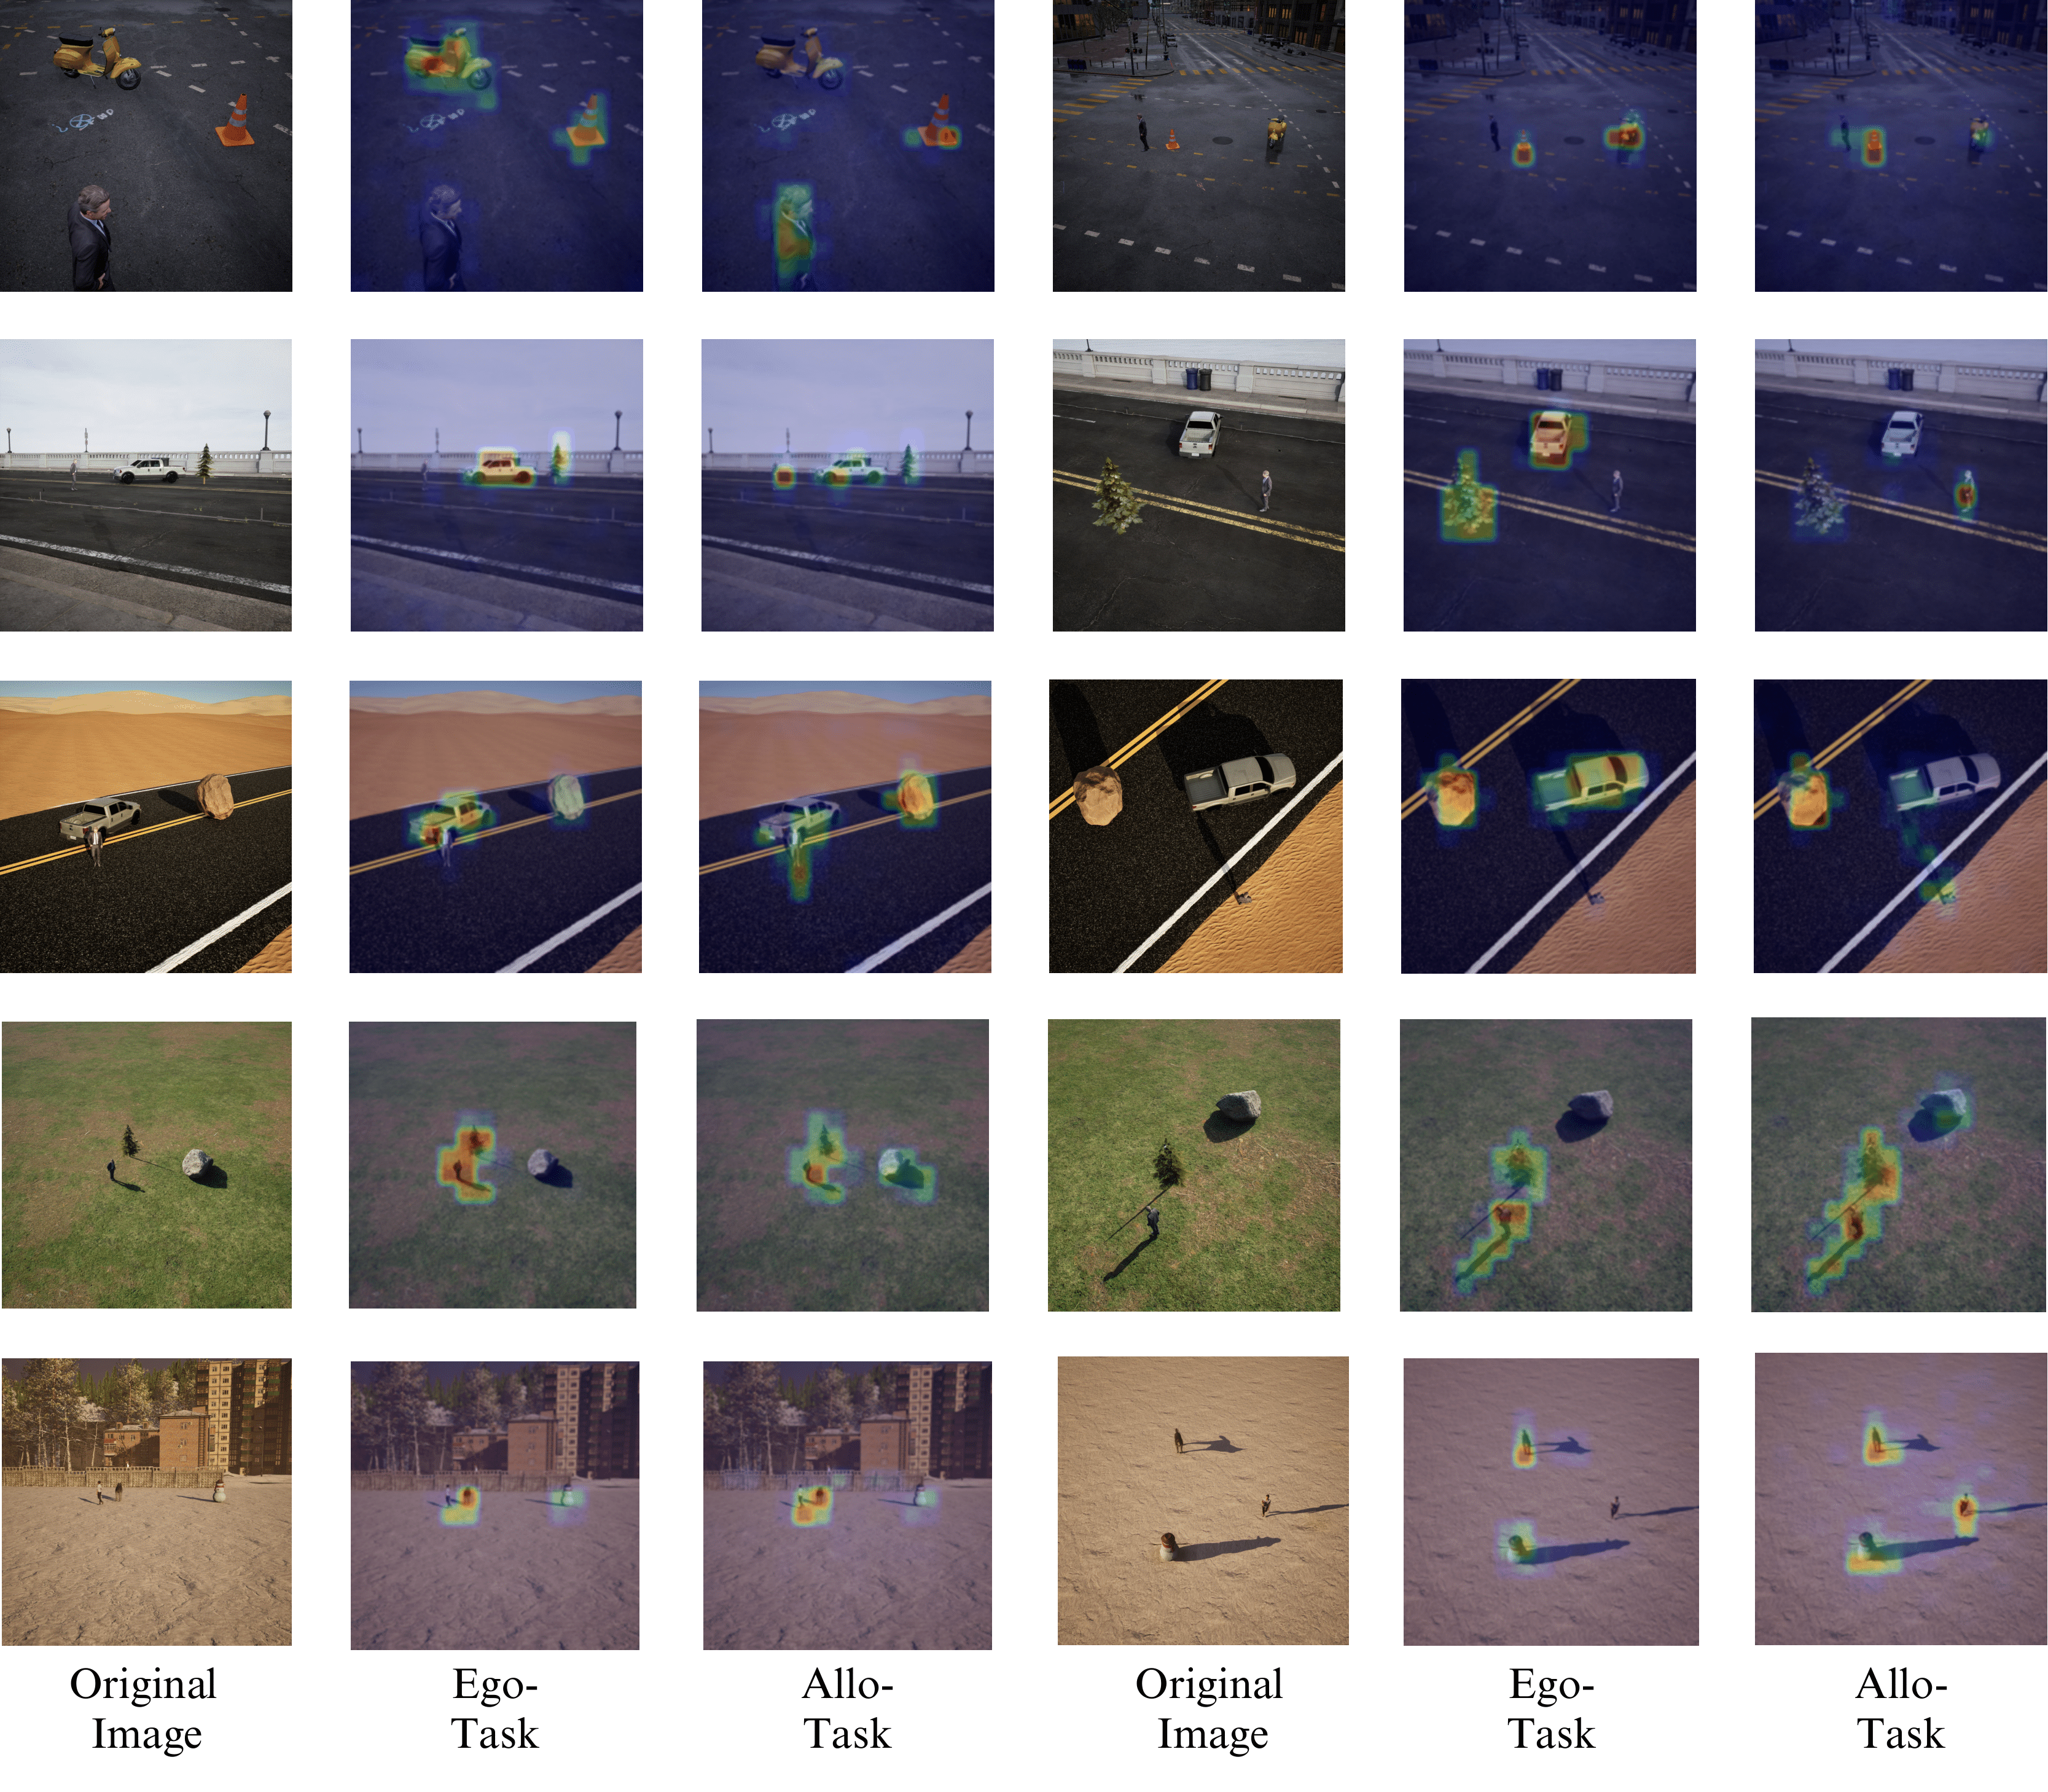
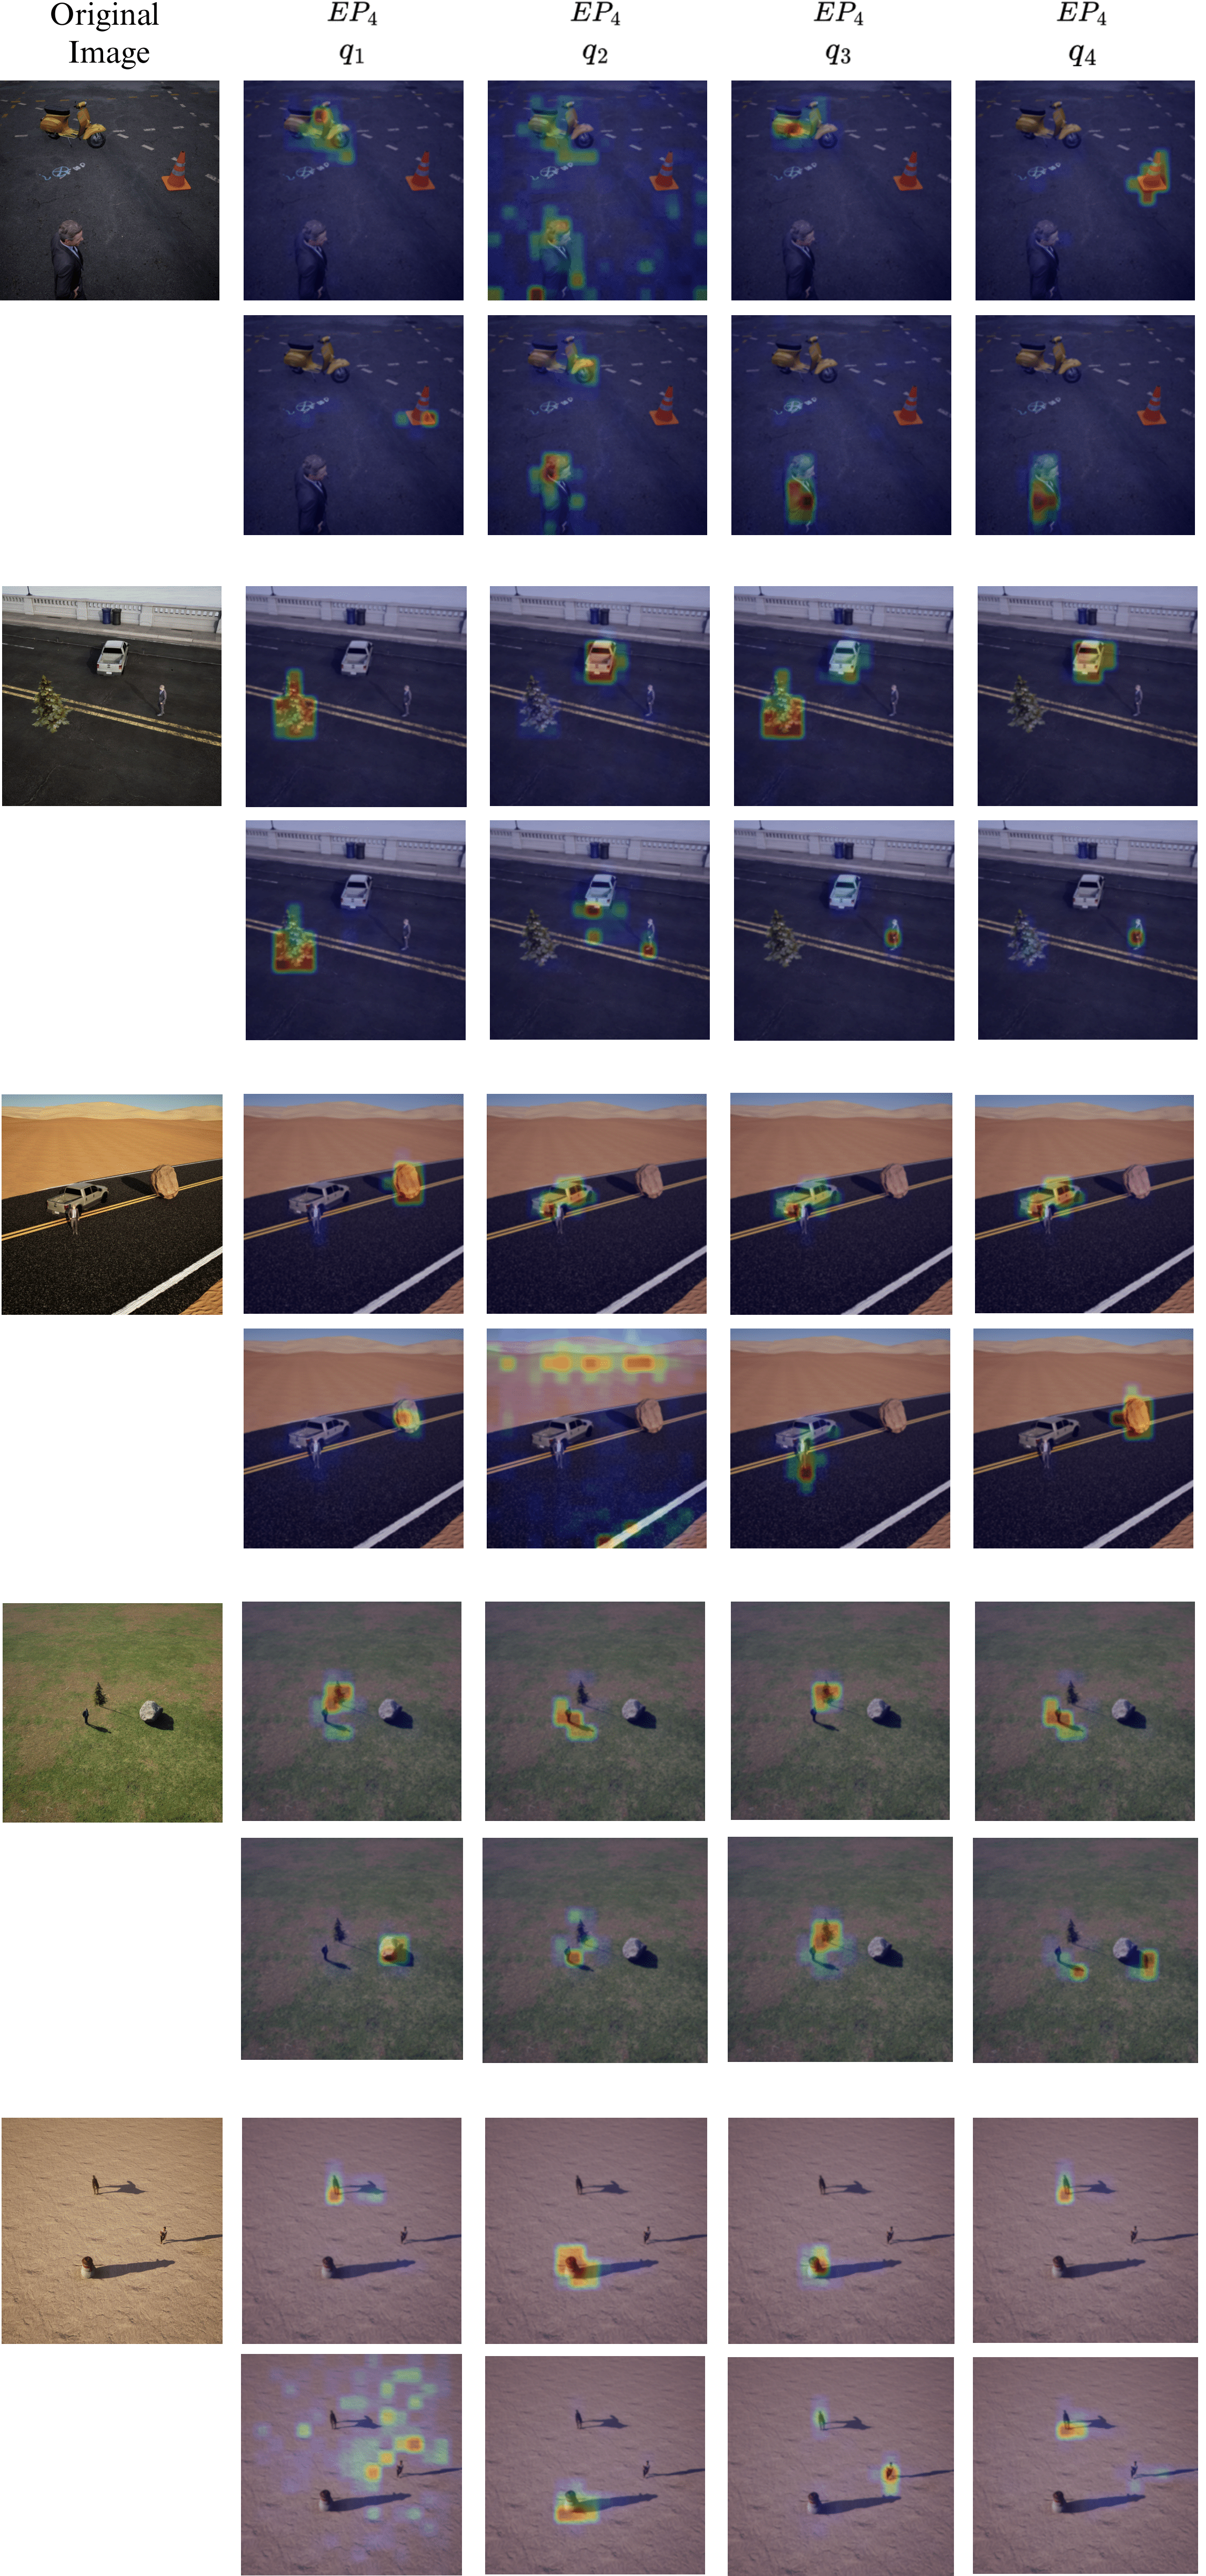
Observation: Different queries specialize to attend to different scene elements (source, target, viewpoint objects), enabling the probe to extract relational information.
Correlation with Other Benchmarks
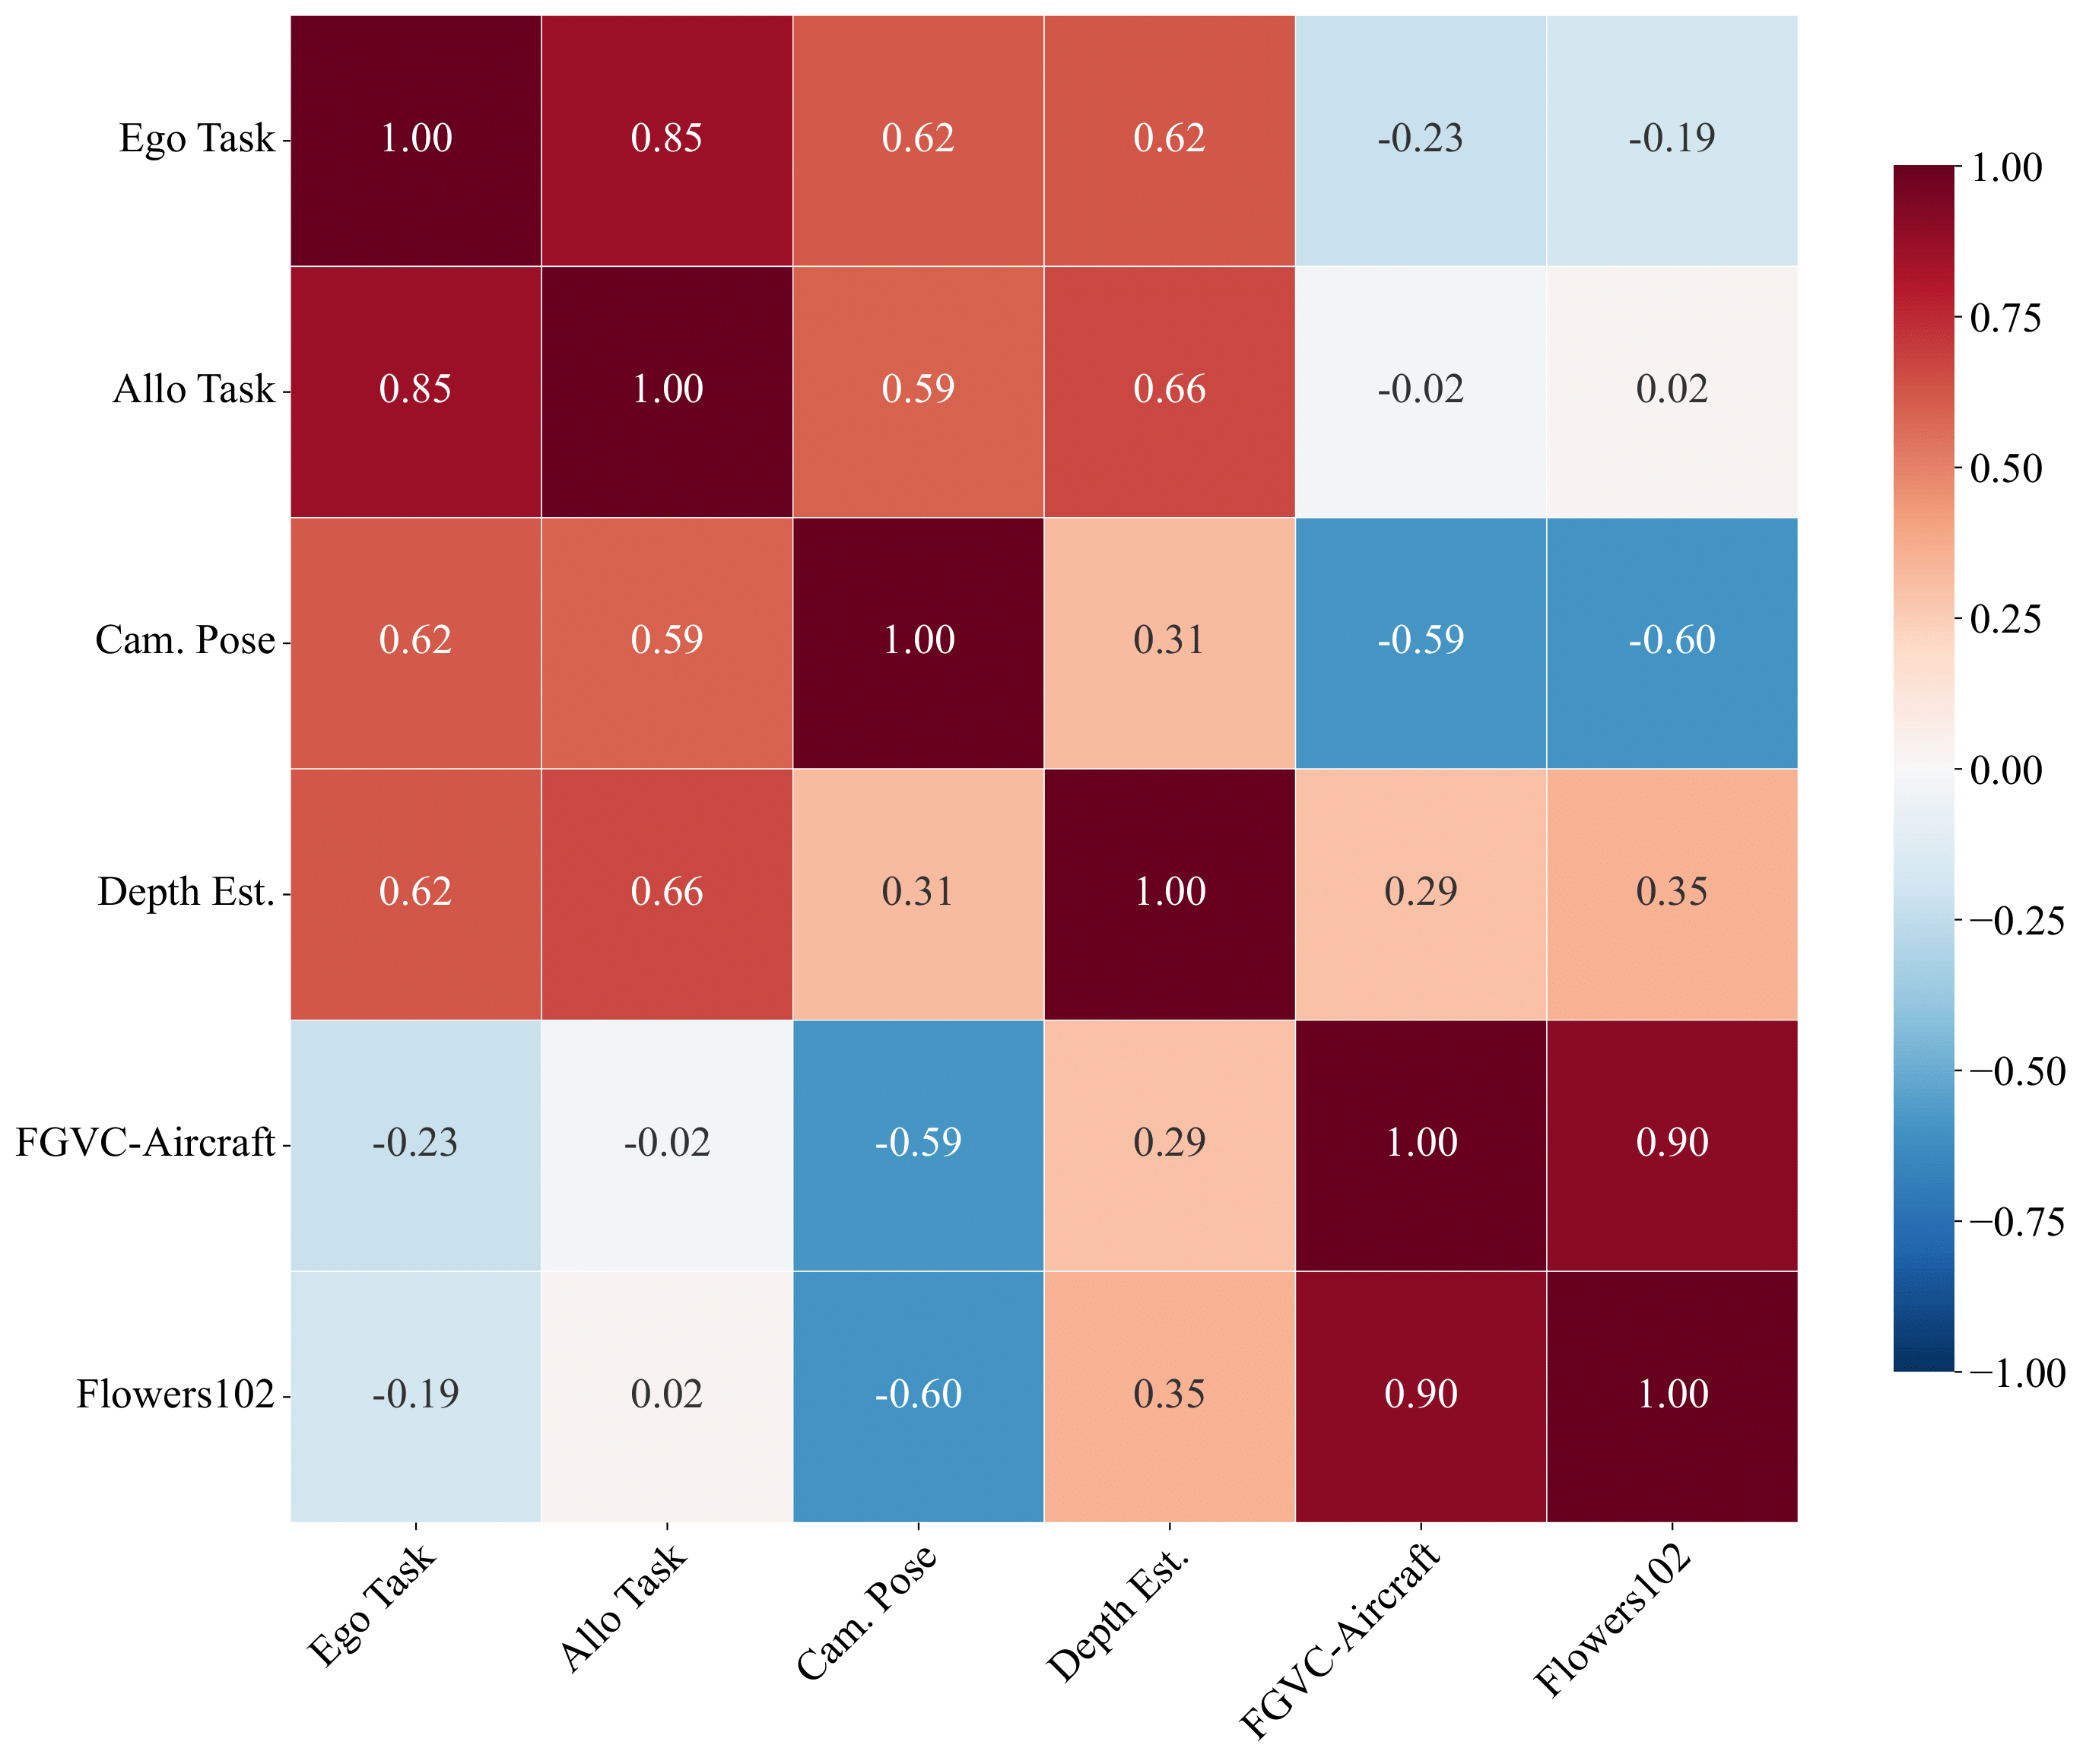
Key Correlations
| Benchmark | SpaRRTa-ego | SpaRRTa-allo |
|---|---|---|
| Depth Estimation | r = 0.62 | r = 0.66 |
| Camera Pose | r = 0.62 | r = 0.59 |
| FGVC Aircraft | r = -0.23 | r = -0.02 |
| Flowers102 | r = -0.19 | r = 0.02 |
Validation
SpaRRTa shows strong correlation with 3D geometric tasks (depth, pose) but no correlation with semantic classification tasks. This confirms that SpaRRTa measures spatial awareness as an independent capability from semantic understanding.
Layer-wise Analysis
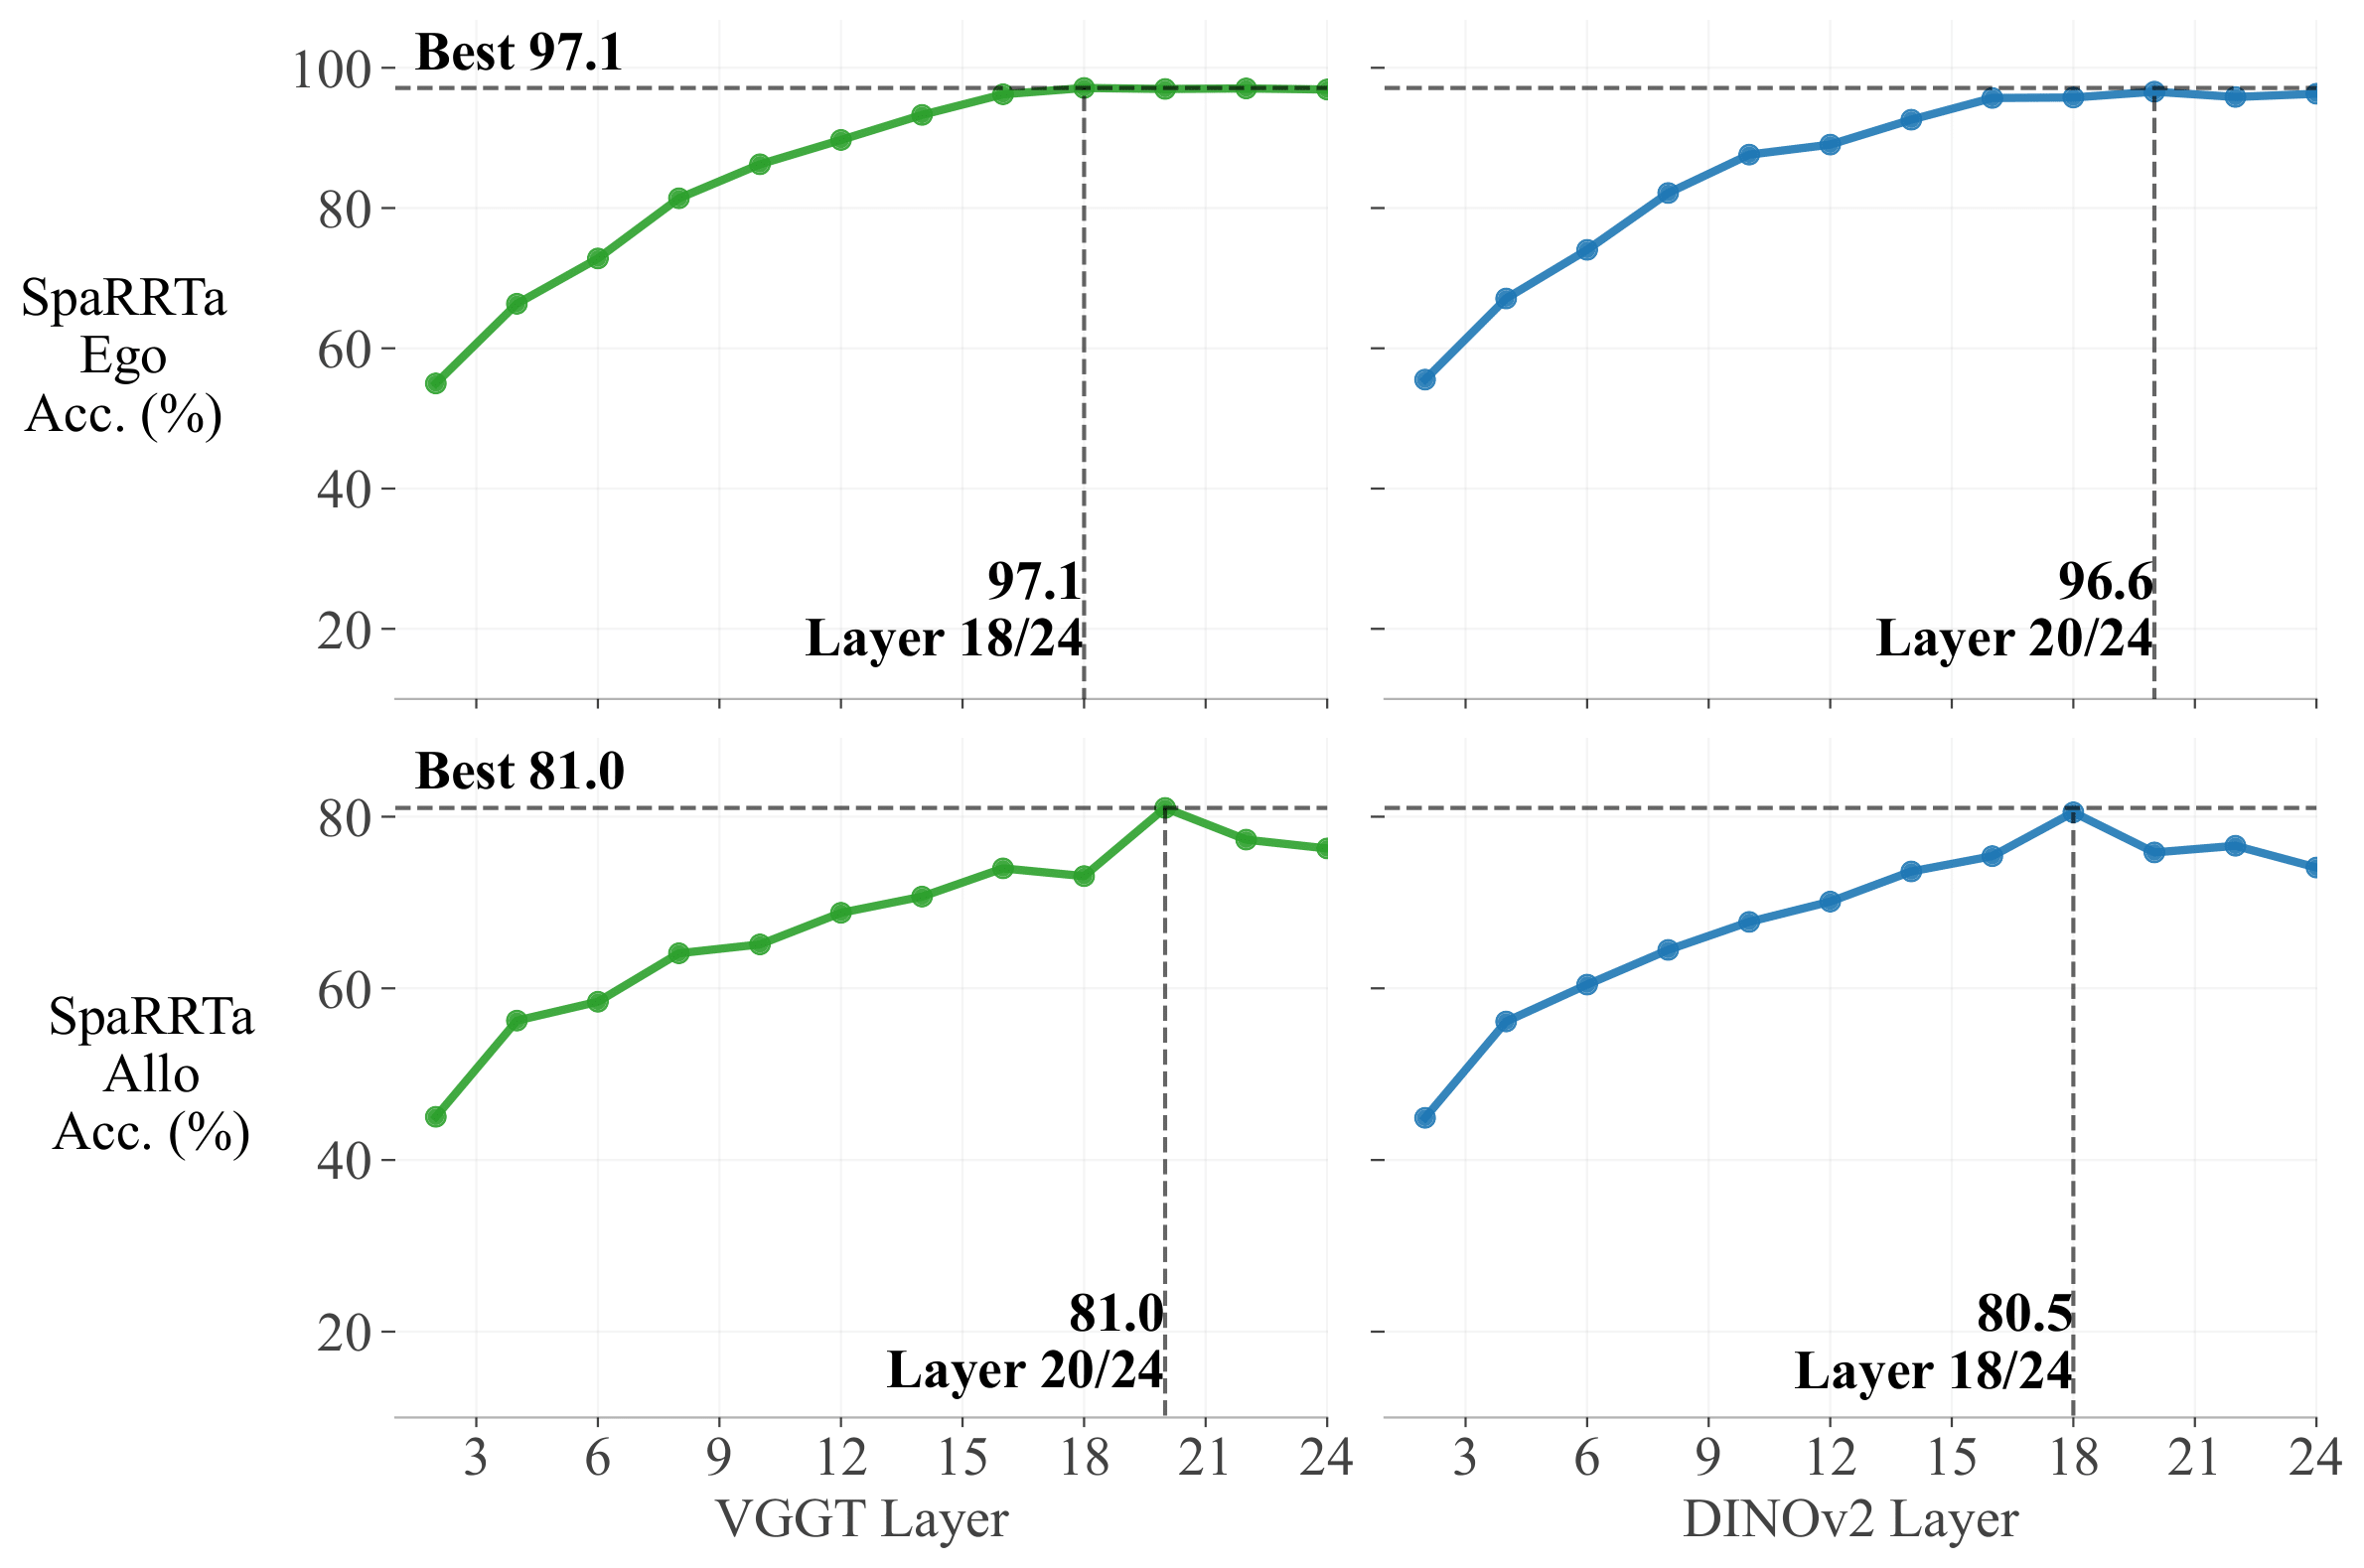
Finding: Spatial information peaks at late-intermediate layers (18-20 for ViT-L), not the final layer. This suggests that final layers prioritize semantic abstraction over geometric detail.
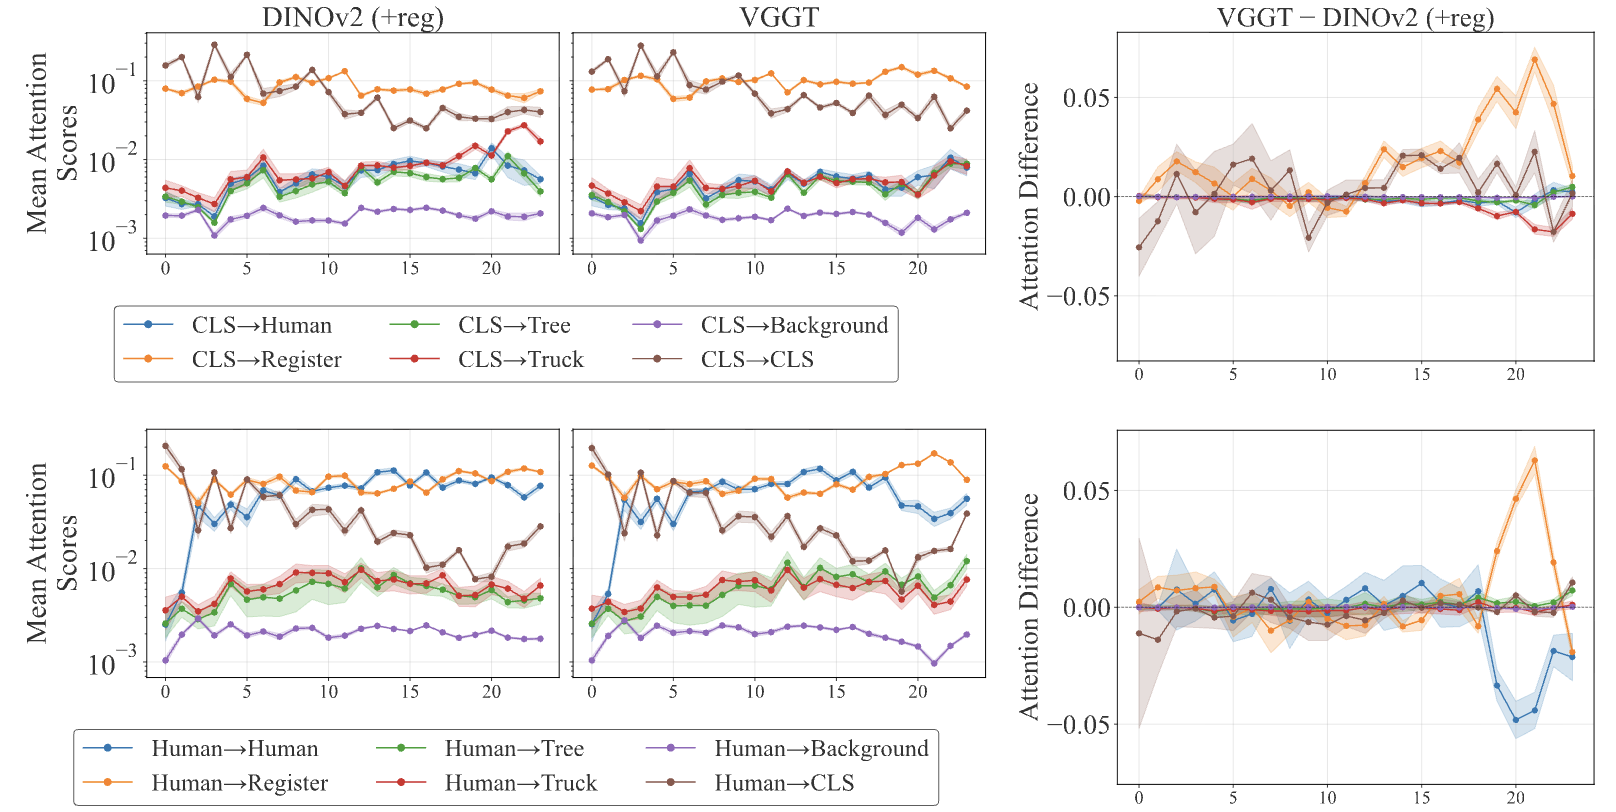
Attention Dynamics Analysis
VGGT vs DINO-v2 Comparison
DINO-v2
- Objects attend strongly to themselves
- CLS token retains object attention
- Linear probing works moderately well
VGGT
- Objects increasingly attend to other objects
- CLS token shifts to register tokens
- Efficient probing unlocks hidden spatial info